
If your team is managing the web servers for one of the busiest ecommerce site or a social media run site, its not quite easy to address all monitoring needs just by looking at the Nagios, Munin and other tools as they collect the data from server and then produce the infographics or send alerts.
Even if you don’t have these tools setup, its better to use tools that give visibility to real time data in a readable format. Take a look at the situation where your web server (Nginx) is failing to serve the pages of your PHP or Rails application hosted. If you don’t see the web service failing but the application not being able to load the sites (Ex: 502 error upstream was unable to serve the page), it is sure that the webserver needs to be checked for configuration optimization .
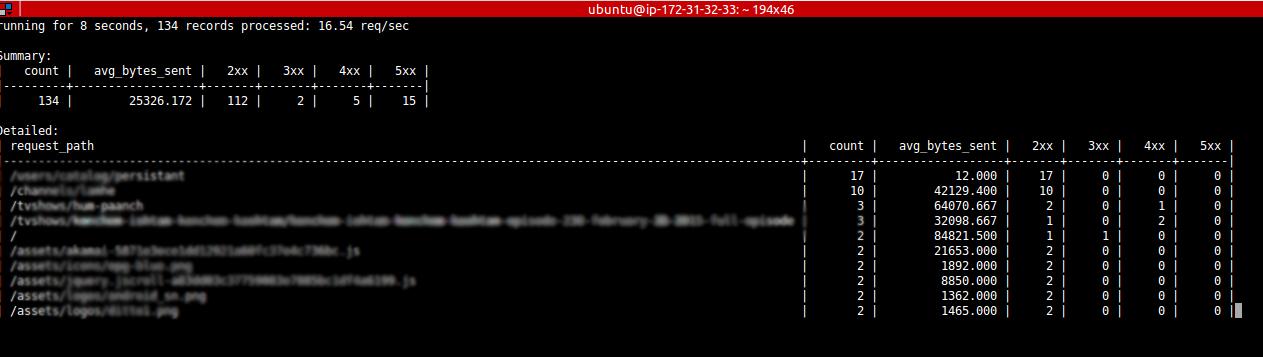
Ngxtop one such tool that you would like to use with your Nginx. This would get you a quick and easy access to incoming requests coming your way from various ip’s, help you see the URL’s, type of HTTP responses just like the way you use “top” command from which it darws the inspiration.
Following image gives you a quick look into the results.
Similarly, You have apachetop for Apache web service.
Installation
Ngxtop is maintained on github ( https://github.com/lebinh/ngxtop/ )
You can install Ngxtop using pip command as follows:
pip install ngxtop
Note: ngxtop is primarily developed and tested with python2 but also supports python3.
Example: Following command shows you the top ip’s and their request counts quickly.
$ ngxtop top remote_addr
running for 20 seconds, 3215 records processed: 159.62 req/sec

top remote_addr
| remote_addr     |   count |
|-----------------+---------|
| 118.173.177.161 |      20 |
| 110.78.145.3    |      16 |
| 171.7.153.7     |      16 |
| 180.183.67.155  |      16 |
| 183.89.65.9     |      16 |
| 202.28.182.5    |      16 |
| 1.47.170.12     |      15 |
| 119.46.184.2    |      15 |


Note: If you want to restrict the output to a specific site to be monitored,
you can use -l switch with the access log file path.
If you want to be very specific on the requests and the referrers you might want to try the following:
$ ngxtop -i 'status >= 400' print request status http_referer
running for 2 seconds, 28 records processed: 13.95 req/sec
request, status, http_referer:
| request   |   status | http_referer   |
|-----------+----------+----------------|
| -         |      400 | -              |
Tip: If you’re planning to monitor a apache access log, ngxtop allows you to do so. Try this:
$ tail -f /var/log/apache2/access.log | ngxtop -f common
The above results would surely help you guide your developers to nail the root cause for the slow applications, increased error rates, Ddos, application performance after the recent changes etc. These opportunities would help you kick start building DevOPS culture of OPS collaborating with Dev for performance optimization.
Trends in SaaS Infrastructure to Look Forward to in 2017
Cloud Implementation Consultation Practices that will Prevail in 2017
DevOps Basics You Should Know Before Adopting Services
Want to learn more about how we can help you? Please feel free to contact us or leave us a comment below.


